Scraping metrics with Prometheus
To scrape metrics from Vertica, you currently need to setup a SQL exporter. This exporter issues queries against Vertica, taking data from various DC tables and virtual tables. This can be costly as it needs to go through the query plan optimizer. For complicated queries, this might result in joins from different tables. In version 23.3.0, Vertica introduced in-database metrics. Vertica is already very rich in metrics with the various system and DC tables that it offers, but now you can get them cheaply with Prometheus in-database metrics.
Vertica scrapes these metrics and outputs them in Prometheus text-based exposition format. This format applies context-specific labels to each metric so you can group metrics when you visualize your data. To export the metrics, we rely on the HTTPS service which exposes general-purpose endpoints for interacting with your database. Vertica exposes metrics through the /v1/metrics endpoint so you can scrape them with a GET request. For example:
curl https://host:8443/v1/metrics \
    --key path/to/client_key.key \
    --cert path/to/client_cert.pem \
The following example outlines the output:
# HELP metric-name metric-definition
# TYPE metric-name metric-type
metric-name{label-key="label-value"[, ...]} metric-value
For example, the following is a snippet of the request response that provides details about the vertica_resource_pool_memory_size_actual_kb metric:
curl https://10.20.30.40:8443/v1/metrics \
    --key path/to/client_key.key \
    --cert path/to/client_cert.pem \
...
# HELP vertica_resource_pool_memory_size_actual_kb Current amount of memory (in kilobytes) allocated to the resource pool by the resource manager.
# TYPE vertica_resource_pool_memory_size_actual_kb gauge
vertica_resource_pool_memory_size_actual_kb{node_name="v_vmart_node0001",pool_name="metadata",revive_instance_id="114b25c4aab6fec8c26b121cff2b52"} 84381
vertica_resource_pool_memory_size_actual_kb{node_name="v_vmart_node0001",pool_name="blobdata",revive_instance_id="114b25c4aab6fec8c26b121cff2b52"} 0
vertica_resource_pool_memory_size_actual_kb{node_name="v_vmart_node0001",pool_name="jvm",revive_instance_id="114b25c4aab6fec8c26b121cff2b52"} 0
...
For a comprehensive list of metrics, see Prometheus metrics.
By exposing the metrics through an HTTP endpoint, we can not only make it easy for Vertica to be a Prometheus target but also visualize the Vertica metrics through a Grafana dashboard.
Prometheus is a monitoring and alerting system that is very popular with cloud native deployments. It collects time series events for different machines, called targets. In this case, the targets are Vertica nodes. To get metrics, Prometheus requires an exposed HTTP endpoint. If an endpoint is available, Prometheus can start scraping numerical data, capture it as a time series, and store it in a local database suited to time-series data. Prometheus is often combined with Grafana in order to visualize collected time-series data.
Grafana is an open-source solution that uses metrics to run analytics and provide insights into the complex infrastructure and massive amounts of data that services process. Grafana also provides customizable dashboards to visualize these analytics. It connects with every possible data source such as Graphite, Prometheus, Influx DB, ElasticSearch, MySQL, PostgreSQL, etc. You can now build dashboards in order to get the most from Vertica Prometheus metrics.
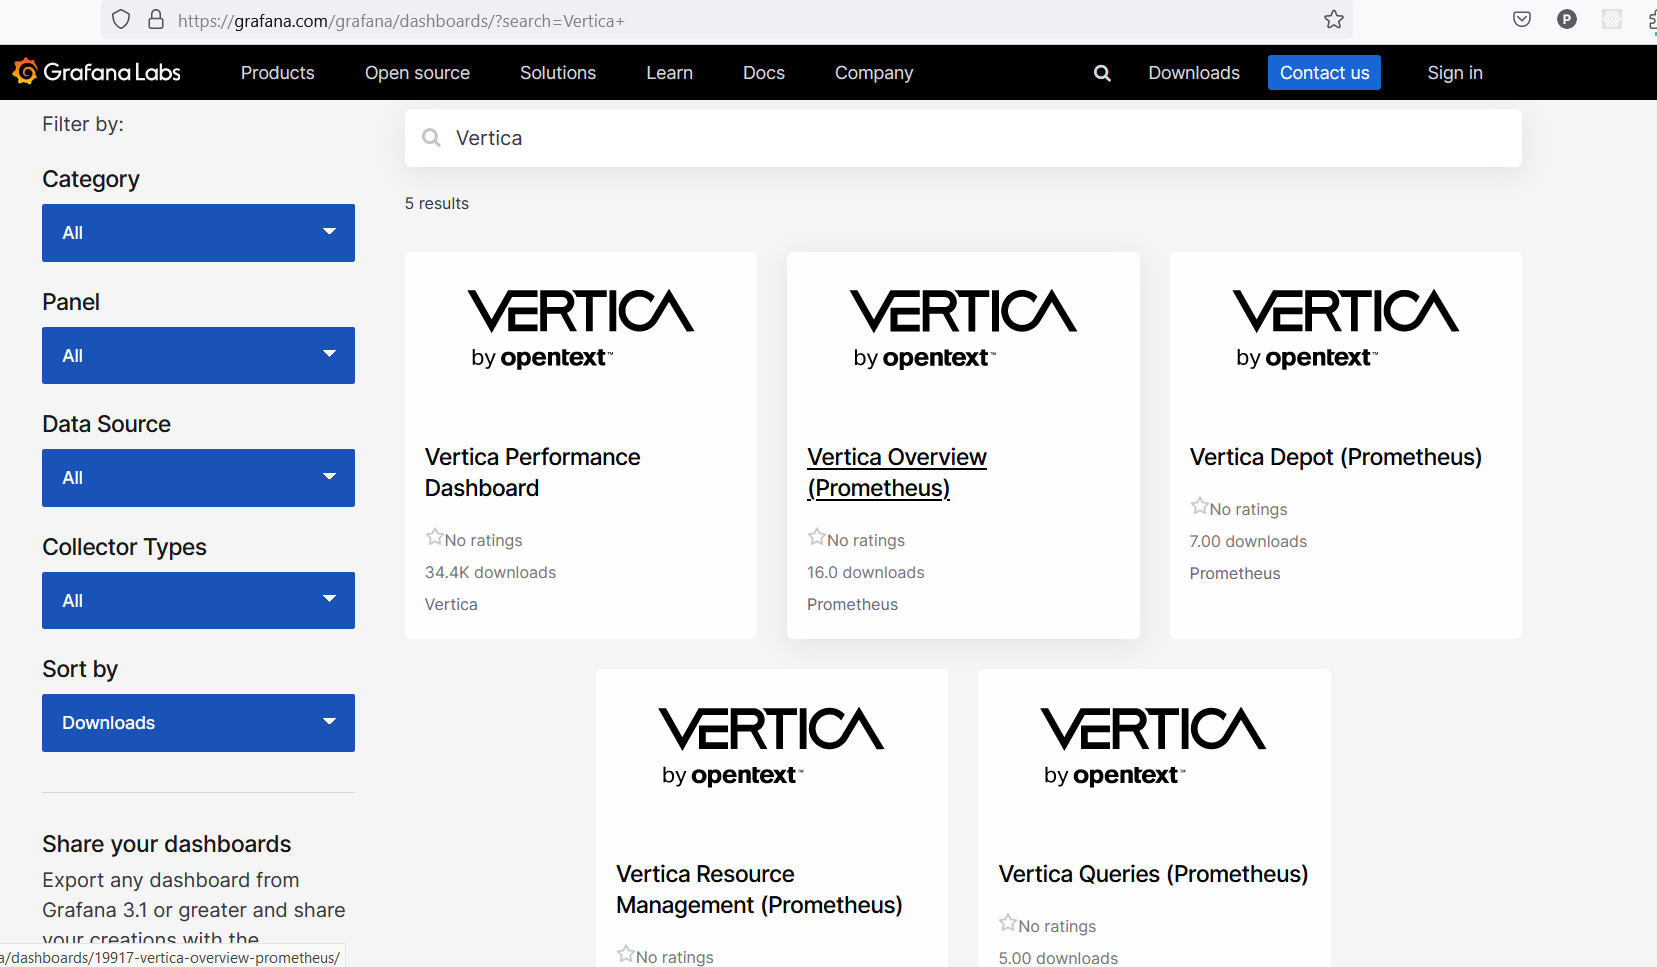
To help you get started, Vertica provides a set of dashboards in the new grafana-dashboards project. The project is open-source, and Vertica welcomes contributions.
So far it consists of four dashboards(EON database only) that are public and available on Grafana:
- Vertica Overview: the overall state of your cluster.
- Vertica Queries: details about queries that are currently running in the cluster.
- Vertica Depot: details about depot usage.
- Vertica Resource Management: details about user-defined and built-in resource pool usage.
You can find all Vertica Prometheus dashboards on Grafana by typing vertica on the search bar:
Setting up Prometheus and Grafana
There are several ways to set up Prometheus and Grafana depending on the environment. It can be on a server (local or in the cloud) or a containerized environment like Docker and Kubernetes. For this tutorial, we are going to use Kubernetes as environment.
Prerequisites:
- minikube Kubernetes (K8s) cluster: if you do not have a cluster available, we install minikube before we begin.
- kubectl: Kubernetes command-line tool. It is needed by Helm.
- Helm: package manager for Kubernetes.
- VerticaDB operator: deploys Vertica on Kubernetes.
Setting up K8s
Let’s set up a Kubernetes cluster and install some Kubernetes tools.
For this tutorial, we are going to use minikube. minikube is local Kubernetes, focusing on making it easy to learn and develop for Kubernetes. Now let’s install minikube. If you are running Linux, you can copy the commands below to your local machine. For other operating systems, refer to the minikube instructions to understand how to set that up.
curl -LO https://storage.googleapis.com/minikube/releases/latest/minikube-linux-amd64
sudo install minikube-linux-amd64 /usr/local/bin/minikube
With the program downloaded, you can create the Kubernetes cluster with the following command:
minikube start
To easily install and manage some of our Kubernetes applications, we need Helm. Helm is a tool that automates the creation, packaging, configuration, and deployment of Kubernetes applications by combining your configuration files into a single reusable package. Before installing Helm, you must have a local configured copy of kubectl:
curl -LO "https://dl.k8s.io/release/$(curl -L -s https://dl.k8s.io/release/stable.txt)/bin/linux/amd64/kubectl"
sudo install -o root -g root -m 0755 kubectl /usr/local/bin/kubectl
If Helm is not already installed, you can install it from a script:
curl -fsSL -o get_helm.sh https://raw.githubusercontent.com/helm/helm/main/scripts/get-helm-3
chmod 700 get_helm.sh
./get_helm.sh
Installing the VerticaDB operator
We are going to install the VerticaDB Operator through Helm charts.
Add the Vertica Helm charts to your local repository, then update your local repository to ensure that it contains the latest available version of the Vertica Helm charts:
helm repo add vertica-charts https://vertica.github.io/charts
helm repo update
Install the operator Helm chart:
helm install --wait -n verticadb-operator --create-namespace vdb-op vertica-charts/verticadb-operator
Deploying a three-node cluster
To create an EON database, we need a location to store communal access data. For testing purposes, we will store the communal data in the minikube VM itself. By default, all host paths in minikube are owned by root. We will create a directory in one of these host paths and make it world readable so that Vertica can write to it.
minikube ssh -- 'sudo mkdir -p /data/vertica && sudo chmod a+w -R /data/vertica'
With the operator deployed, we can now create a Vertica cluster. I will create a three-node cluster running with CE license. Run this command to create a local manifest for the VerticaDB custom resource (CR):
cat << EOF > vdb.yaml
apiVersion: vertica.com/v1
kind: VerticaDB
metadata:
  name: v
  annotations:
    vertica.com/include-uid-in-path: "true"
    vertica.com/run-nma-in-sidecar: "false"
    VERTICA_MEMDEBUG: "2"  # Required if running macOS with an arm based chip
spec:
  image: vertica/vertica-k8s:24.1.0-0-minimal
  communal:
    path: "/communal"
  subclusters:
  - name: sc1
    size: 3
  volumes:
  - name: server
    hostPath:
      path: /data/vertica
  volumeMounts:
  - name: server
    mountPath: /communal
EOF
Run this to create the above CR that will deploy Vertica:
minikube kubectl -- apply -f vdb.yaml
Downloading the image and creating the database will take a few minutes. You can run this command to wait for the process to finish. Depending on your internet connection speed, you may need to repeat this command a few times.
minikube kubectl -- wait vdb v --for=condition=DBInitialized=True --timeout=10m
Install Prometheus and Grafana
We are going to use Kube Prometheus Stack. It collects Kubernetes manifests, Grafana dashboards, and Prometheus rules combined with documentation and scripts to provide easy to operate end-to-end Kubernetes cluster monitoring with Prometheus using the Prometheus Operator.
helm repo add prometheus-community https://prometheus-community.github.io/helm-charts
helm repo update
helm install prometheus prometheus-community/kube-prometheus-stack --version 55.0.0
Afterwards we can list our pods and see if everything is running smoothly:
kubectl get pods

alertmanager-prometheus-kube-prometheus-alertmanager-0   2/2     Running             0          115s
prometheus-grafana-7c68644486-8wf95                      3/3     Running             0          2m17s
prometheus-kube-prometheus-operator-7dccfb674d-4bb4z     1/1     Running             0          2m17s
prometheus-kube-state-metrics-6cd846d5cf-gwsb2           1/1     Running             0          2m17s
prometheus-prometheus-kube-prometheus-prometheus-0       2/2     Running             0          111s
prometheus-prometheus-node-exporter-m6k2b                1/1     Running             0          2m17s
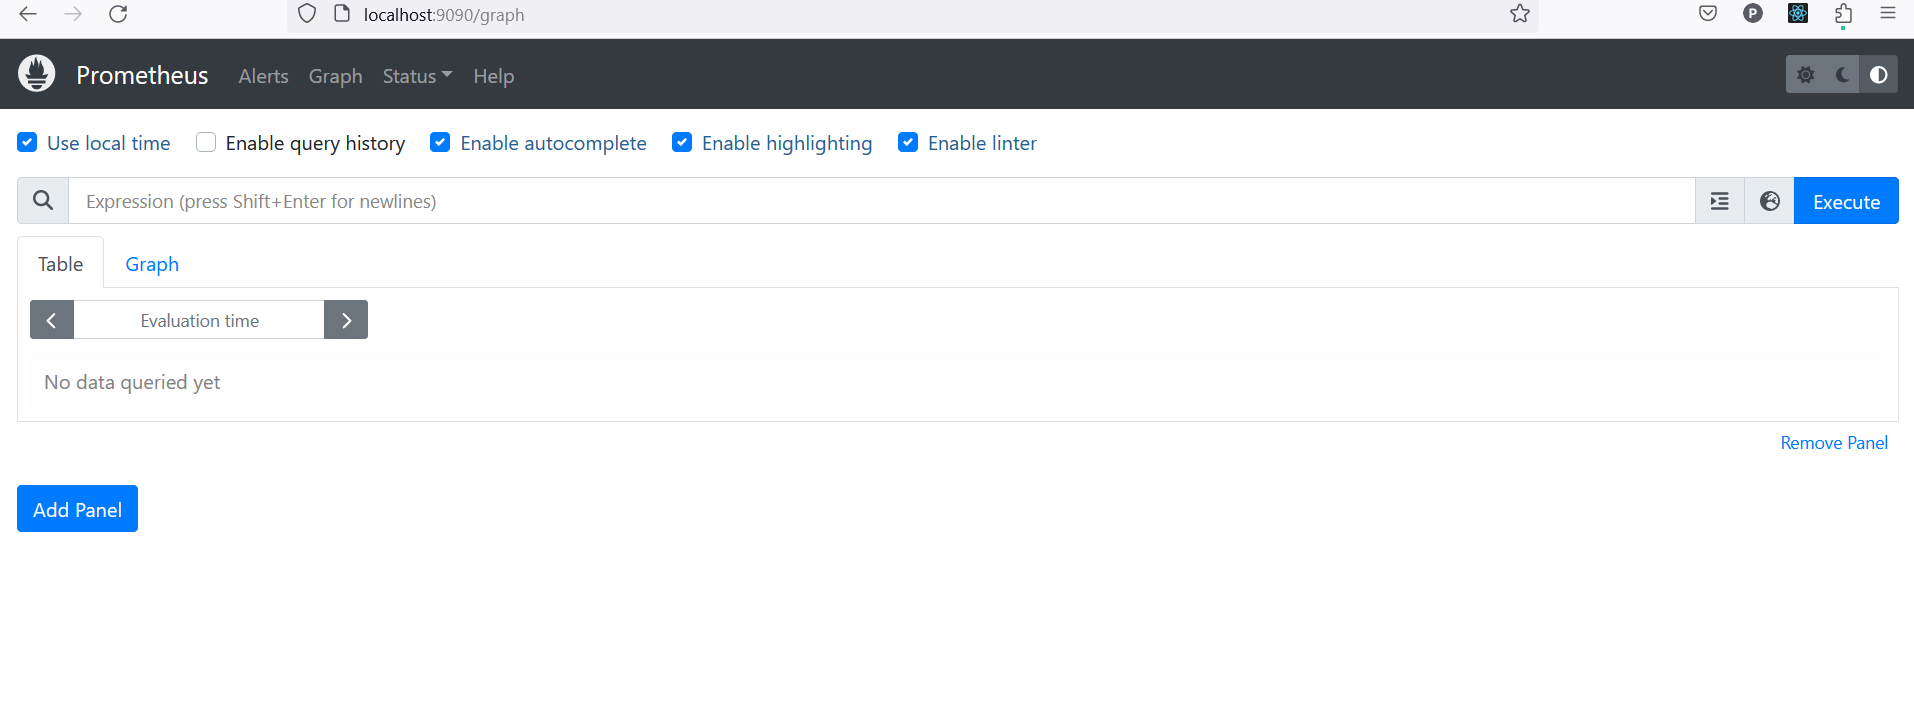
You can access Prometheus UI. Run the following command to expose prometheus and access the dashboard on http://localhost:9090:
kubectl port-forward svc/prometheus-operated 9090
Prometheus is running but cannot connect to Vertica pods yet. To allow it to discover Vertica service, we are going to install a serviceMonitor. Run this command to create a local manifest for the service monitor:
cat << EOF > service-monitor.yaml
apiVersion: v1
kind: Secret
metadata:
  name: dbadmin
data:
  username: ZGJhZG1pbg==
  password: ''
type: Opaque
---
apiVersion: monitoring.coreos.com/v1
kind: ServiceMonitor
metadata:
  name: vertica-server
  labels:
    release: prometheus
spec:
  endpoints:
    - basicAuth:
        password:
          key: password
          name: dbadmin
        username:
          key: username
          name: dbadmin
      interval: 1s
      path: /v1/metrics
      port: vertica-http
      scheme: https
      tlsConfig:
        insecureSkipVerify: true
  selector:
    matchLabels:
      app.kubernetes.io/name: vertica
EOF
Run this to create the above serviceMonitor:
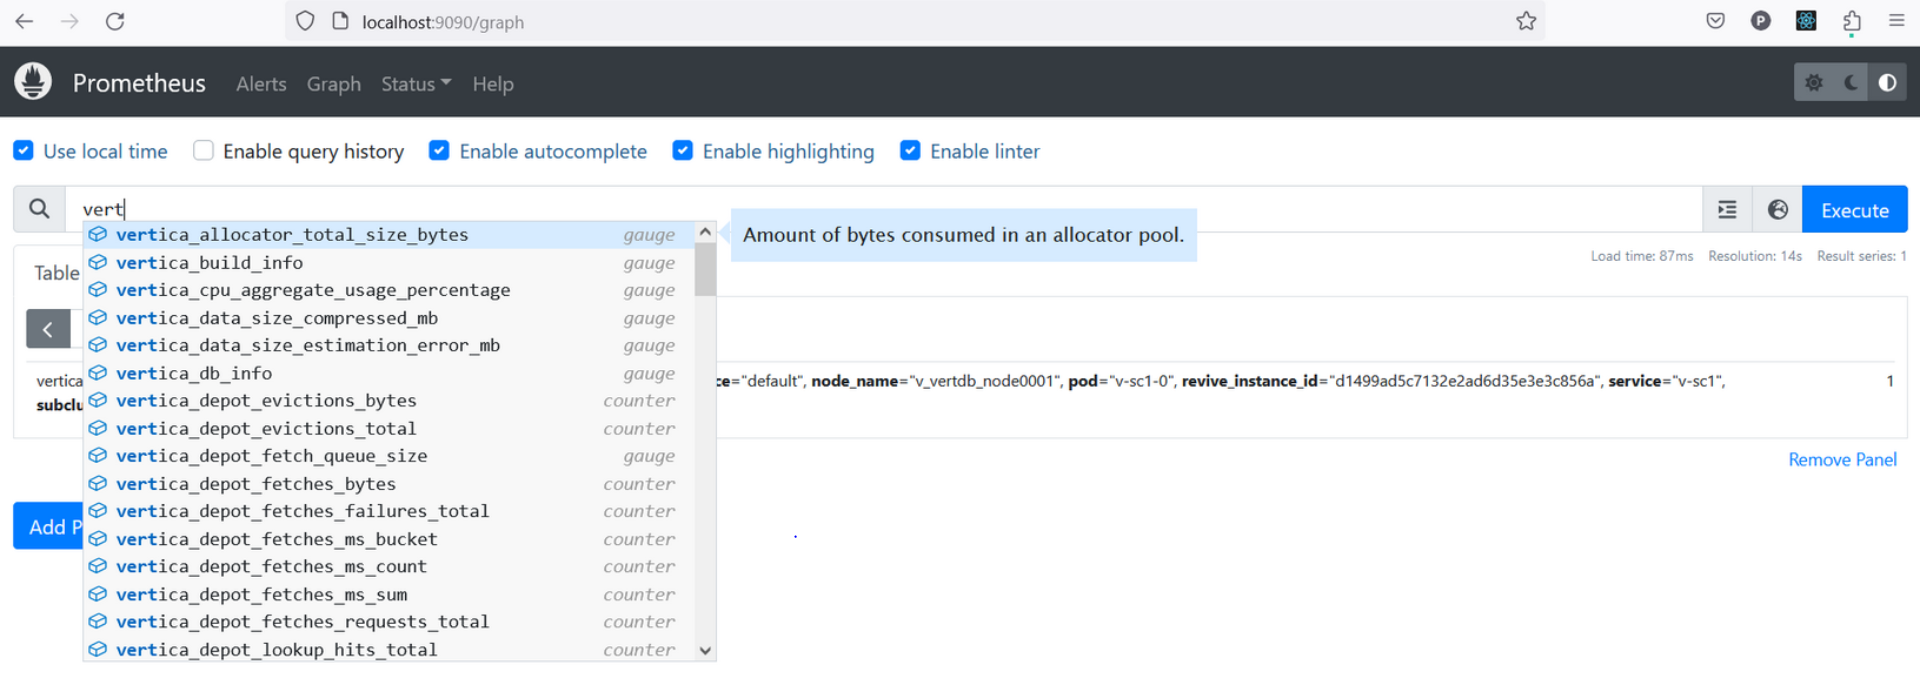
minikube kubectl -- apply -f service-monitor.yaml
Wait a little and refresh Prometheus on the browser. You will now be able to query the metrics:
You can access Grafana UI. Run the following command to expose Grafana and access the dashboard on http://localhost:3000:
kubectl port-forward svc/prometheus-grafana 3000:80
Log in with the following credentials:
Username: admin
Password: prom-operator
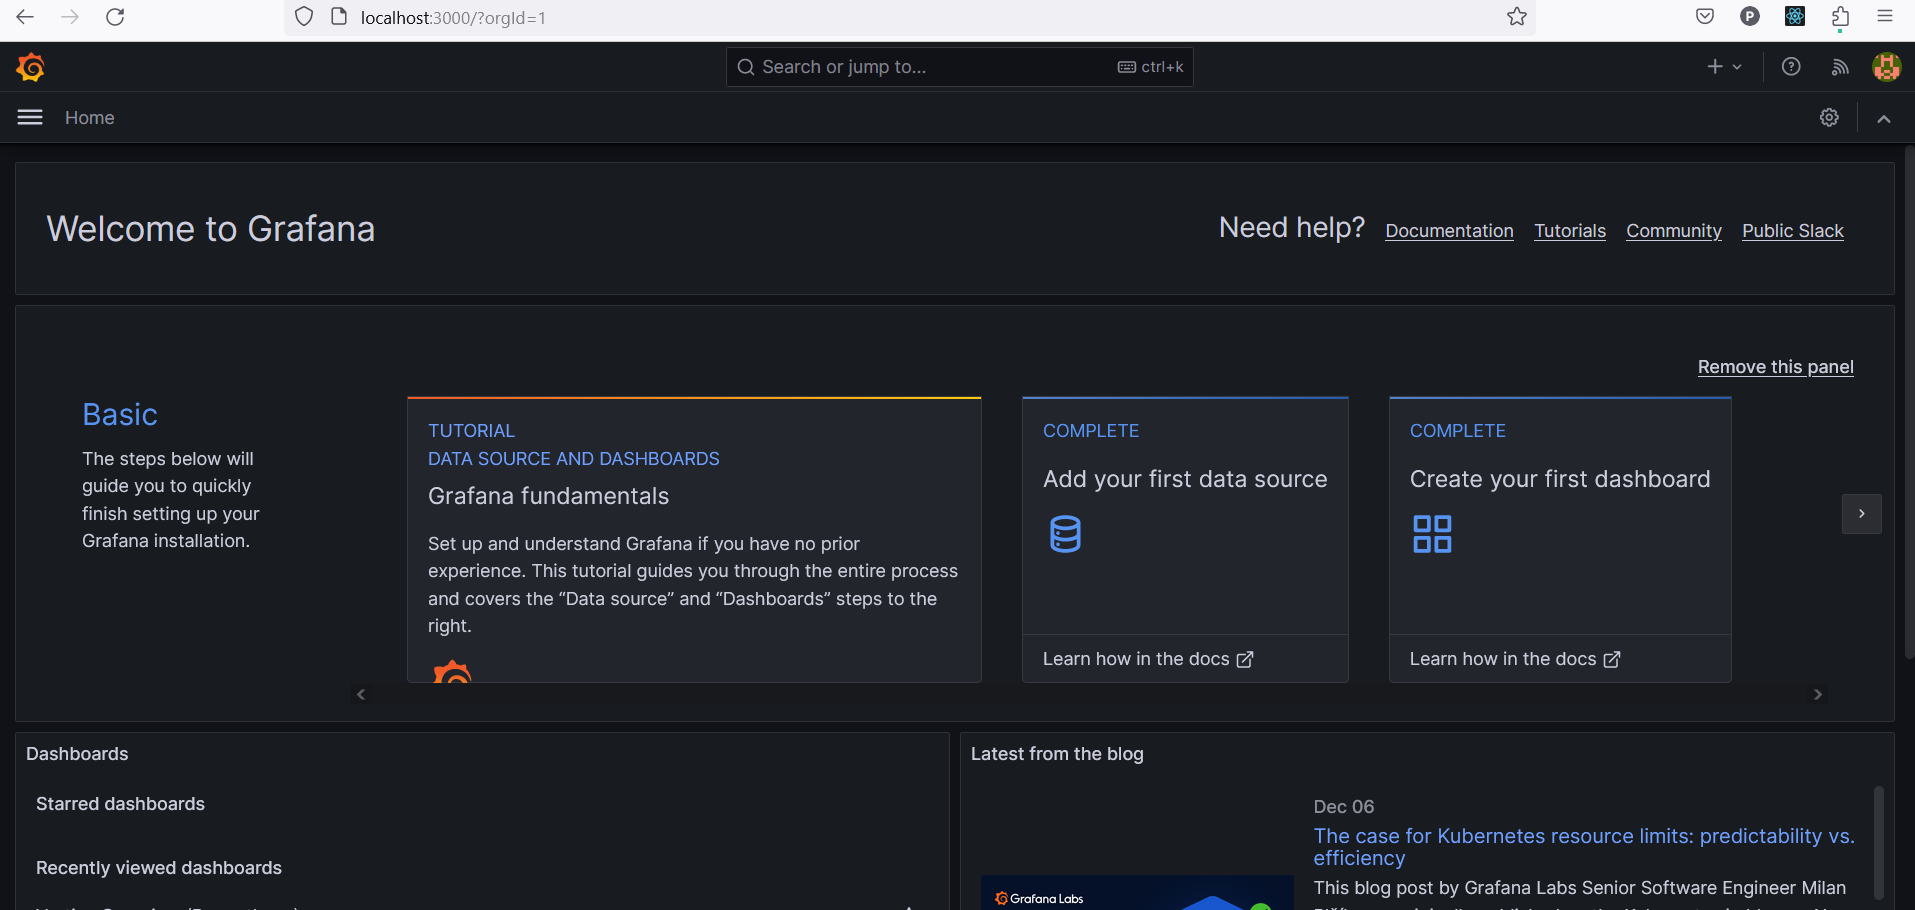
You would normally have to create a Prometheus data source in order for Grafana to connect to Prometheus but in this deployment, Grafana is pre-configured to connect to the Prometheus installed above.
Now, all that is left is to import the dashboards. First, we import Vertica Overview. Copy the dashboard ID and go to Grafana.
Paste the ID in Home > Dashboards > New > import > import via grafanana.com:
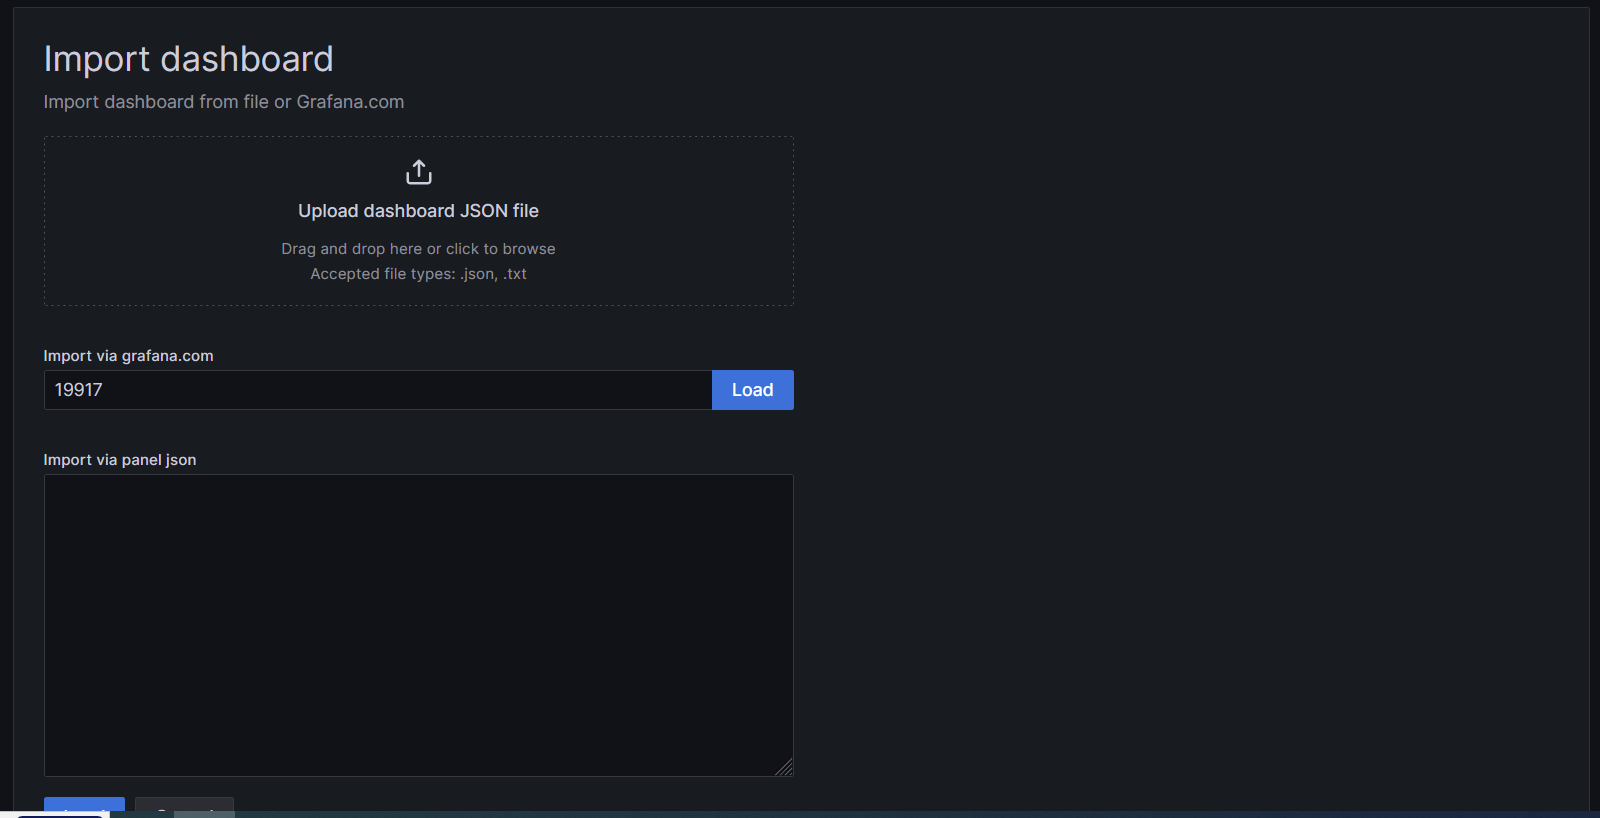
Load the dashboard and click on Import. You will be able to view the dashboard:
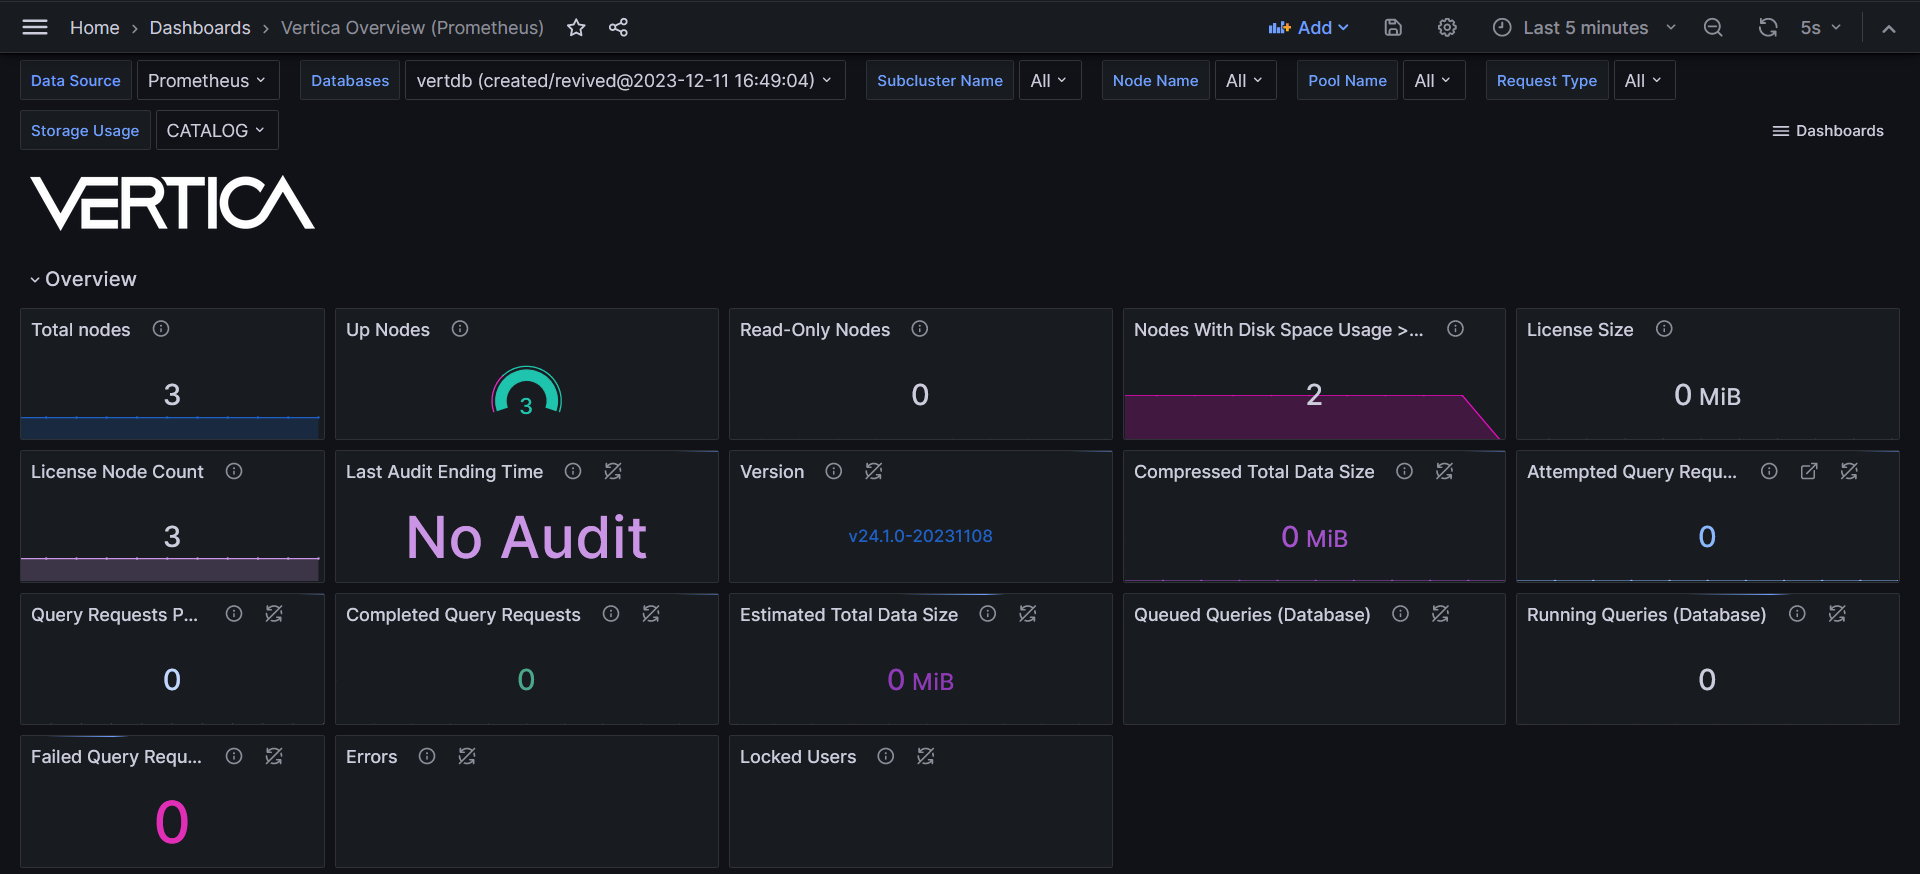
All the other dashboards can be imported the same way.
Tear down K8s cluster
To clean up the minikube cluster after you are finished with it, run the following command:
minikube delete